

So many warming alarmists are convinced that the poles and tropics warm at the same rate. That truly would be alarming. And this makes some of them think that the tropics will burst into flames if the ice completely melts at the poles. This is laughable in the extreme. Bill Nye taking a blowtorch to a plastic globe is the epitome of criminal stupidity. NASA talking about Earth having a fever is not merely government incompetence, but criminal collusion with international globalists to spread propaganda to the public-at-large.
Video on Uneven Warming
If you wish to see the video on YouTube, click Uneven Warming: Poles vs. Tropics.
Water as Earth’s Thermostat
As we discussed in the last article and video, oceans are Earth’s wonderful thermostat. Water prevents the wild temperature swings we find in the deep deserts.
But what controls how quickly temperatures change on Earth, and at different latitudes?
When there is lots of water, temperatures change very slowly. For one thing, we have water’s high specific heat.
For another thing, most of the ocean is relatively cold, especially below a certain depth. The deep ocean is at close to 40°F (4°C)—just above freezing. So, before we get the surface of Earth warming up more rapidly, we have to warm up the deeper waters. And that is going to take thousands of years.
Also, as ice melts—and throughout our current Ice Age, it always has melted—more ice is deposited from snow. As Earth warms up, the rate of snow fall increases, so the depth of snowy ice along the coast increases far more rapidly. This slows down the rate of sea level rise. In fact, scientists currently think that the majority of our modern sea level rise is not from ice melting, but from thermal expansion. As most things heat up, they take up more room.

One big exception to this rule is water ice. This is why ice floats in liquid water, instead of sinking to the bottom. This is yet another wonderful property of water to help buffer the changes in climate, protecting the oceans from freezing over too quickly.
The Arctic sea ice has melted lots of times during the Holocene, especially during each major warm period—1,000-year cycle—and during the Holocene Optimum, which ended roughly 6,000 years ago. During that far warmer period, the Sahara was green for about 3,000 years.
As we learned in the last video, warming in the tropics is slowed down by evaporative cooling and cloud shading. Deserts get a little hotter, but they tend to shrink in size from the extra rain from increased evaporation. This includes the monsoon effect.
At higher latitudes, the sun’s light comes in at a steep angle, warming the surface less effectively—reflected off of water and bouncing off of snow. As the snow melts, exposing darker ground, warming rates increase.
Global Temperature Changes
If rates of warming were linear, it would still take hundreds of years to melt all the ice on Greenland, and thousands of years to melt all of the ice on Antarctica. But warming is definitely NOT linear. Climate changes in cycles. In the 1940s to 1970s, we had significant cooling. In the late 1970s to the late 1990s, we had significant warming. This follows the AMO, 60-year cycle—the Atlantic Multi-decadal Oscillation.
I have lived in the tropics for nearly 14 years, roughly 10° north of the equator, and it is never as hot as it was the decade I lived in Phoenix, Arizona, where it got up to 120°F (49°C). Where I now live, in the tropics, the temperature rarely gets above 90°F (32°C). Most of the time it’s quite comfortable. As I write this, it’s raining and a moderately cool 77°F (25°C).
Antarctica is protected by a circumpolar current that blocks warmer current. Some 40 million years ago, Australia was still close to the southernmost continent and redirected warmer currents toward Antarctica, keeping it from freezing.
Right now, Earth would have to warm up quite a bit before Antarctica would reverse the rate of ice accumulation. The southernmost continent is always losing ice. The ice sheet can only get so thick before gravity pulls that ice sideways and out to sea.
Earth Burst Into Flames? Hogwash!

Some warming alarmists have stated their fears that the tropics would become unlivable if Scandinavia ever became tropical. This is pure nonsense. Because of evaporative cooling and cloud shading, the tropics would only warm a minor amount compared to the poles.
The end result of global warming would be that the poles would become far more like the mid-temperate zone while the tropics would become only slightly warmer. And most of the tropics is in the 80–90°F (26.7–32.2°C) range. To have the tropics warm to 82–92°F (27.8–33.3°C) would not be cause for alarm, but for celebration.
Hot deserts would warm a bit more, but even there, the loss would be insignificant. And some deserts may gain monsoon circulation, turning them green, like the Sahara was for 3,000 years during the warmer Holocene Optimum.
Addendum: 2021:0601
Occasionally, one of my YouTube videos will get a spurt of traffic from a critic’s video. All too often the trolls who descend on my tiny video are not out to teach (or to learn), but to troll, smash and burn. It’s all quite hilarious to see them gnash their virtual teeth in such a predictable fashion. On the Bill Nye video, the watchword they chanted was “metaphor.” Really!
Bill Nye taking a blowtorch to a globe of Earth is no more a metaphor for the Modern Warm Period than a jackhammer is a proper substitute for a feather duster.
metaphor n. One thing conceived as representing another; a symbol.
exaggerate v. tr. To consider, represent, or cause to appear as larger, more important, or more extreme than is actually the case; overstate.
How much of an exaggeration is the Bill Nye “metaphor?” In other words, how far has Bill Nye stretched the limits of the notion of one thing representing another? Consider the following facts:
REALITY
+0.74°C in 140 years
BILL NYE
+1,300°C in 0.1 second
CLIMATE COMPARISONS:
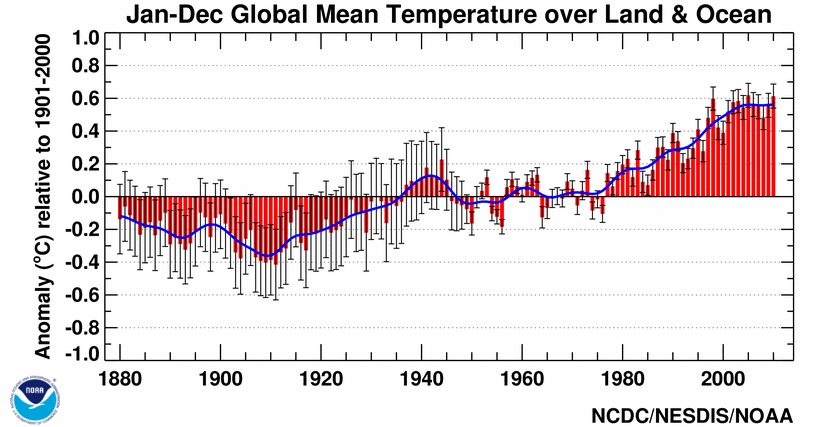
Our modern warming is neither fast nor unusually strong. Just the facts, ma’am.
1979-1998 Trend Line
-0.24 to 0.08 = 0.32/19 yrs; rate per century: +1.68C
y = 0.0164x – 32.61; R^2 =0.1932
1998-2018 Trend Line
0.1 to 0.24 = 0.14/20 yrs; rate per century: +0.7C (slowed down considerably)
y = 0.0074x – 14.625; R^2 = 0.0493
(from satellite data, UAH)
1817-1818 Warming
+1°C; rate per century: +50°C
1326-1296 BC Warming
+1.4°C; rate per century: +4.7°C
6140-6110 BC Warming
+1.9°C; rate per century: +6.3°C
9620-9610 BC Warming (end of Younger Dryas)
+10°C; rate per century: +100°C
So you see, the modern warming is pretty wimpy compared to past warming spikes, and none of them were worthy of a Bill Nye blowtorch. Again, Bill Nye’s blowtorch is inappropriate by several orders of magnitude. It’s like (a simile) using a Saturn V rocket (the kind that sent men to the Moon) to go to the corner market. Dumb!
“The fundamental cause of the trouble is that in the modern world the stupid are cocksure while the intelligent are full of doubt.”—Bertrand Russell (1872–1970)
“To understand the actual world as it is, not as we should wish it to be, is the beginning of wisdom.”—Bertrand Russell
Yet, there is a time for certainty and a time for restraint and humility. Some never learn these things.
References
Alley, Richard. (2000). “Holocene Epoch: Subatlantic Chronozone.” Retrieved on 2016:0613 from http://s90.photobucket.com/user/dhm1353/media/Climate%20Change/Subatlantic_Had.png.html
Archive.org. (2012:0127). “Temperature -vs- CO2: Last 800,000 Years.” Retrieved on 2016:0618 from http://web.archive.org/web/20120127155937/http://robertb.darkhorizons.org/TempGr/Vostok.JPG
Broecker, W.S. (1998). “The End of the Present Interglacial: How and When?” Quaternary Science Reviews, Vol. 17, pp. 689-694, 1998.
Cohen, Tamara. (2013:0919). “World’s top climate scientists told to ‘cover up’ the fact that the Earth’s temperature hasn’t risen for the last 15 years.” Retrieved on 2016:1104 from http://dailymail.co.uk/news/article-2425775/Climate-scientists-told-cover-fact-Earths-temperature-risen-15-years.html
Deming, Dr. David. (2006:1206). “Statement of Dr. David Deming.” Retrieved on 2016:0708 from http://epw.senate.gov/hearing_statements.cfm?id=266543
Fairbanks, R. (1989:1207). “A 17,000-year glacio-eustatic sea level record: influence of glacial melting rates on the Younger Dryas event and deep-ocean circulation,” Nature, Vol. 342.
Hasegawa, H., Tada, R., et al. (2012:0823). “Drastic shrinking of the Hadley circulation during the mid-Cretaceous Supergreenhouse.” Retrieved on 2015:1119 from http://clim-past.net/8/1323/2012/cp-8-1323-2012.pdf
Humlum, Ole. (ND). “10,700 years — GISP2 — with CO2 from EPICA DOME C.” Retrieved on 2016:0613 from http://climate4you.com/images/GISP2%20TemperatureSince10700%20BP%20with%20CO2%20from%20EPICA%20DomeC.gif
Lamb, Hubert H. (2012:1124). Climate: Present, Past and Future: Volume 2: Climatic History and the Future. Routledge Revivals, Abingdon-on-Thames, UK.
Lovelock, J.E. & Whitfield, M. (1982:0408) “Lifespan of the Biosphere.” Nature 296, 561–563.
Maue, Ryan. (2014:0930). “Global Hurricane Frequency.” Retrieved on 2015:1114 from http://policlimate.com/tropical/global_major_freq.png
Maue, Ryan. (2014:0930). “Global Tropical Cyclone Accumulated Cyclone Energy (ACE). Retrieved on 2015:1114 from http://policlimate.com/tropical/global_running_ace.png
Mudelsee, M., et al, (2003:0911). “No upward trends in the occurrence of extreme floods in central Europe.” Retrieved on 2016:0618 from http://nature.com/nature/journal/v425/n6954/full/nature01928.html
Mudelsee, M., et al. (2004:1202). “Extreme floods in central Europe over the past 500 years: Role of cyclone pathway ‘Zugstrasse Vb’.” Retrieved on 2016:0618 from http://onlinelibrary.wiley.com/doi/10.1029/2004JD005034/full
NCDC. (ND). Graph: “Jan-Dec Global Mean Temperature over Land & Ocean.” Retrieved 2015:1114 from http://ncdc.noaa.gov/sotc/service/global/global-land-ocean-mntp-anom/201001-201012.gif
NOAA. (ND). “U.S. Annual Count of EF-1+ Tornadoes, 1954 through 2014.” Retrieved 2015:1029 from http://www1.ncdc.noaa.gov/pub/data/cmb/images/tornado/clim/EF1-EF5.png
NOAA. (ND). “U.S. Annual Count of Strong to Violent Tornadoes (F3+), 1954 through 2014.” Retrieved 2015:1029 from http://www1.ncdc.noaa.gov/pub/data/cmb/images/tornado/clim/EF3-EF5.png
NOAA. (ND). “GISP2 Volcanic Markers.” Retrieved on 2008:0801 from ftp://ftp.ncdc.noaa.gov/pub/data/paleo/icecore/greenland/summit/gisp2/chem/volcano.txt
Norris, Richard. (ND). “Cretaceous Thermal Maximum ~85-90 Ma.” Retrieved on 2016:1103 from http://scrippsscholars.ucsd.edu/rnorris/book/cretaceous-thermal-maximum-85-90-ma
NSIDC. (ND). “Quick Facts on Ice Sheets.” Retrieved on 2015:1113 from https://nsidc.org/cryosphere/quickfacts/icesheets.html
Rose, David. (2015:0118). “Nasa climate scientists: We said 2014 was the warmest year on record… but we’re only 38% sure we were right.” Retrieved on 2016:0118 from http://dailymail.co.uk/news/article-2915061/Nasa-climate-scientists-said-2014-warmest-year-record-38-sure-right.html

One thought on “Uneven Warming: Poles vs. Tropics”